

If your child quotes figures from an IB Economics extract but stops before explaining what they show, check how they connect the evidence to an economic conclusion. In a data-response question, the figures are there to be used, not just copied out. Restating what a number says is not the same as drawing a conclusion from it.
What is this about?
- Using data to support a conclusion is a core IB Economics skill, and the data-response paper puts it to the test.
- Restating a number is not the same as drawing a conclusion from it.
- Our three-step check is: read it, do one thing with it, then say what follows.
- There is a short restate-or-conclude task at the end you can try at home this week.
Where IB Economics data answers go wrong
If your child writes down what a figure says and stops there, that is restating. In a data-response question, a table or a short extract appears, and the answer repeats the number without saying what it means. Restating the figure alone does not show the examiner what economic conclusion your child has drawn. Using the figure to support a relevant economic point is what makes the data do useful work in the answer. We practise reading the data first, then connecting it to the economics needed for the question.
Restate, or conclude?
In a data-response question, a figure needs to be used, not just copied out. Here is the three-step check we teach.
Read the number
Say what the figure or table row shows. If the question asks for an explanation, use that as your starting point.
Do one thing with it
Pick a move that fits. You could calculate it, compare it, combine it with another figure, connect it to an idea, or challenge what it leaves out.
Say what follows
Write a relevant economic point supported by the data. State any assumption you need, and answer the question asked.
Rents rose from 900 to 1,460 between 2016 and 2024.
Rents rose by about 62 per cent. That alone does not show whether rent became less affordable: we also need income figures for the same period.
These rent figures are invented for this example. Your child does not need every move in every answer: choose one that supports the point and state what the data cannot show.
How we teach it
We first practise reading the figure and choosing a useful move. The child then writes a supported economic point and checks any assumptions. This is a Greenhill practice routine, not a fixed IB answer formula. We use it within full Paper 2 practice, matching the response to the question and its command term.
Greenhill tutor
Theo, Economics tutor
Theo teaches IB Economics with Greenhill and is studying Economic History at the London School of Economics, where he is on track for a First.
Restating, or concluding?
Tell us where your child’s Paper 2 data answers break down. A tutor can look at one and help identify where the response stops using the data effectively.
Ask about a tutorA figure, turned into a conclusion
These figures are invented to show the steps. They are not from a real paper.
The figure
A table shows that a country’s unemployment rate fell from 8.0 per cent to 5.6 per cent over four years.
Turning it into a conclusion
First, read it: unemployment fell from 8.0 to 5.6 per cent. Then do one thing with it: that is a fall of 2.4 percentage points. Then say what follows: one possible conclusion is that, if more people are in work, household income and spending could rise, which may support stronger demand. That last step shows how the figure can support an economic conclusion.
Try this at home this week
This takes about eight minutes. It gives you a quick indication of whether your child restates the figure or moves towards an economic conclusion.
What you need. Paper, a pen, and the four statements below, which we have written out for you.
The question. These four statements use invented figures. For each one, write ‘restating’ or ‘a conclusion’. Rewrite any restatement using a calculation, comparison or clearly stated assumption: ‘Exports rose from 40 billion to 52 billion.’; ‘Annual inflation rose from 3 per cent to 7 per cent, so prices rose faster. If money incomes rose by less than 7 per cent in the second year, purchasing power fell.’; ‘The minimum wage went up by 5 per cent.’; ‘Youth unemployment is 18 per cent and adult unemployment is 5 per cent, so the youth unemployment rate is 13 percentage points higher.’
- Read each statement.
- Write ‘restating’ or ‘a conclusion’ next to it.
- For each ‘restating’ one, pick one move that fits.
- Rewrite it as one economic conclusion.
- Check that the figure supports the new point. State any assumption or missing information.
What to watch. Watch whether your child moves beyond repeating a figure while keeping the new point supported by the information given.
What it cannot tell you. This short task does not tell you whether your child can explain the economics behind the figure, draw the diagrams, evaluate a policy, or write a full Paper 2 answer.
Where a tutor takes it next. That is where a tutor picks it up: first the data-to-conclusion habit, then using it inside complete IB Economics Paper 2 questions.
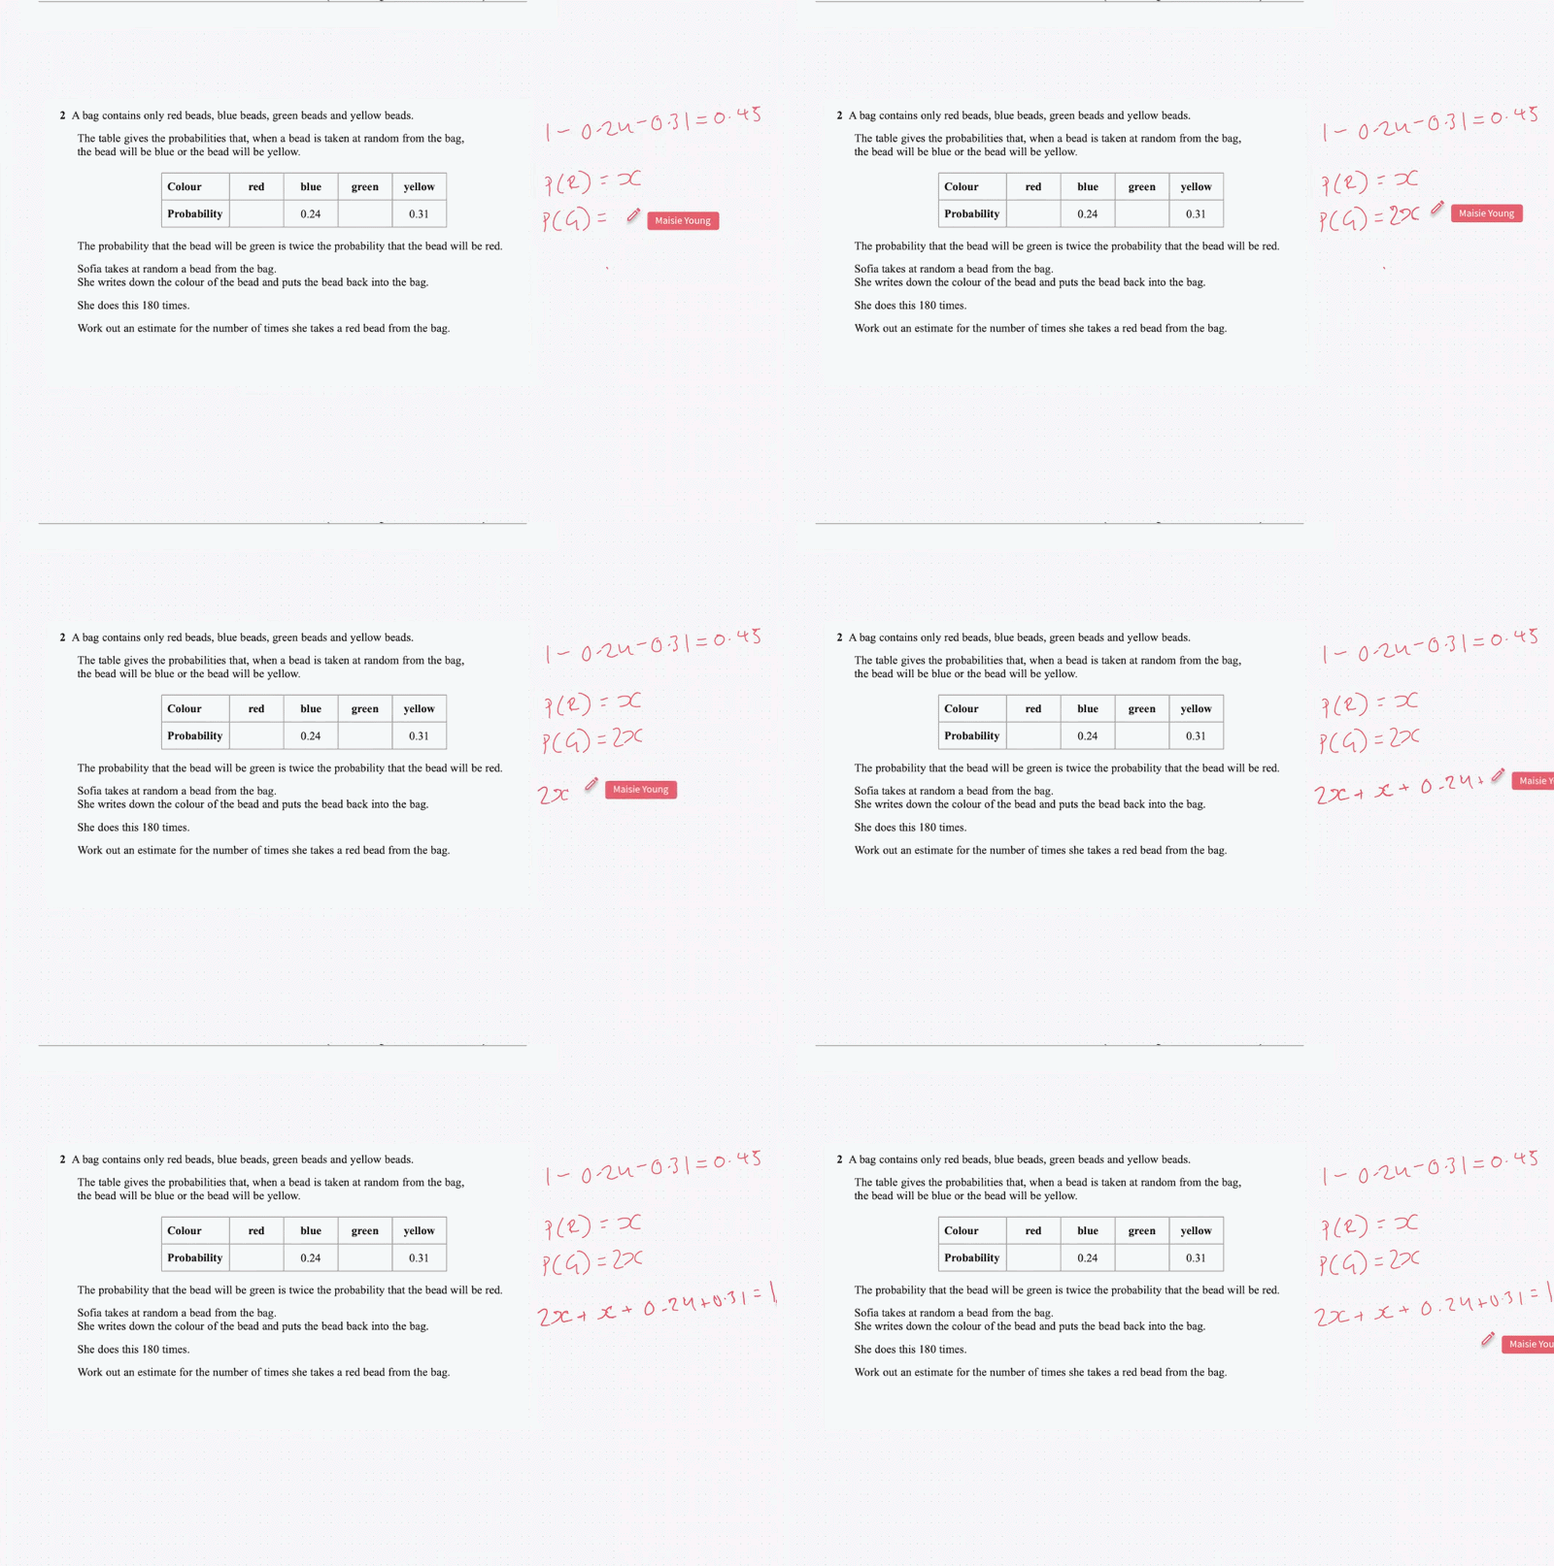
This clip shows a maths lesson recorded in Pencil Spaces, the online classroom used by Greenhill Academics.
Our IB Economics tutors

Theo teaches IB Economics with Greenhill. He is studying Economic History at the London School of Economics, where he is on track for a First.

Kevin holds an MSc in Financial Economics from the University of Oxford and teaches Economics with Greenhill, including at IB level.
Questions parents ask us
My child knows the economics but loses marks on the data questions. Why?
Paper 2 is a data-response paper, so students need to use the information provided, not just repeat it. If your child copies a number out without drawing a conclusion from it, the answer does not show the examiner what economic point they are making.
What do you teach them to do with a figure?
Three steps. Read the number, do one thing with it, then write the conclusion that follows. The move could be to calculate, compare, combine, connect or challenge the figure.
Is this just for IB Economics?
The data-to-conclusion habit also helps with building a chain of analysis in economics essays. Paper 2 is a natural place to practise it because it is a data-response paper.
Do you tutor IB Economics online?
Yes. We tutor IB Economics online for UK and international families. Tell us the paper your child finds hardest, and we can talk through the help they need.
How quickly can this improve?
It depends on the child. The three-step check is short, but using it under exam time takes practice on real data questions. A tutor can show you what that practice looks like.
Want a tutor to work on IB Economics with your child?
Tell us the paper your child finds hardest, and we can talk through the help they need.
Send an enquiry